Making Antarctic Maps and Figures with Quantarctica
June 7, 2017
13:00 - 14:00 GMT
Description
One of the most time-consuming and stressful parts of any Antarctic research project is simply making a map. Whether it’s plotting your own data points, lines, or images; making the perfect “Figure 1” for your next paper, or replying to a collaborator who says “Just show me a map!,” it seems that quick and effective map-making is a skill that we take for granted.
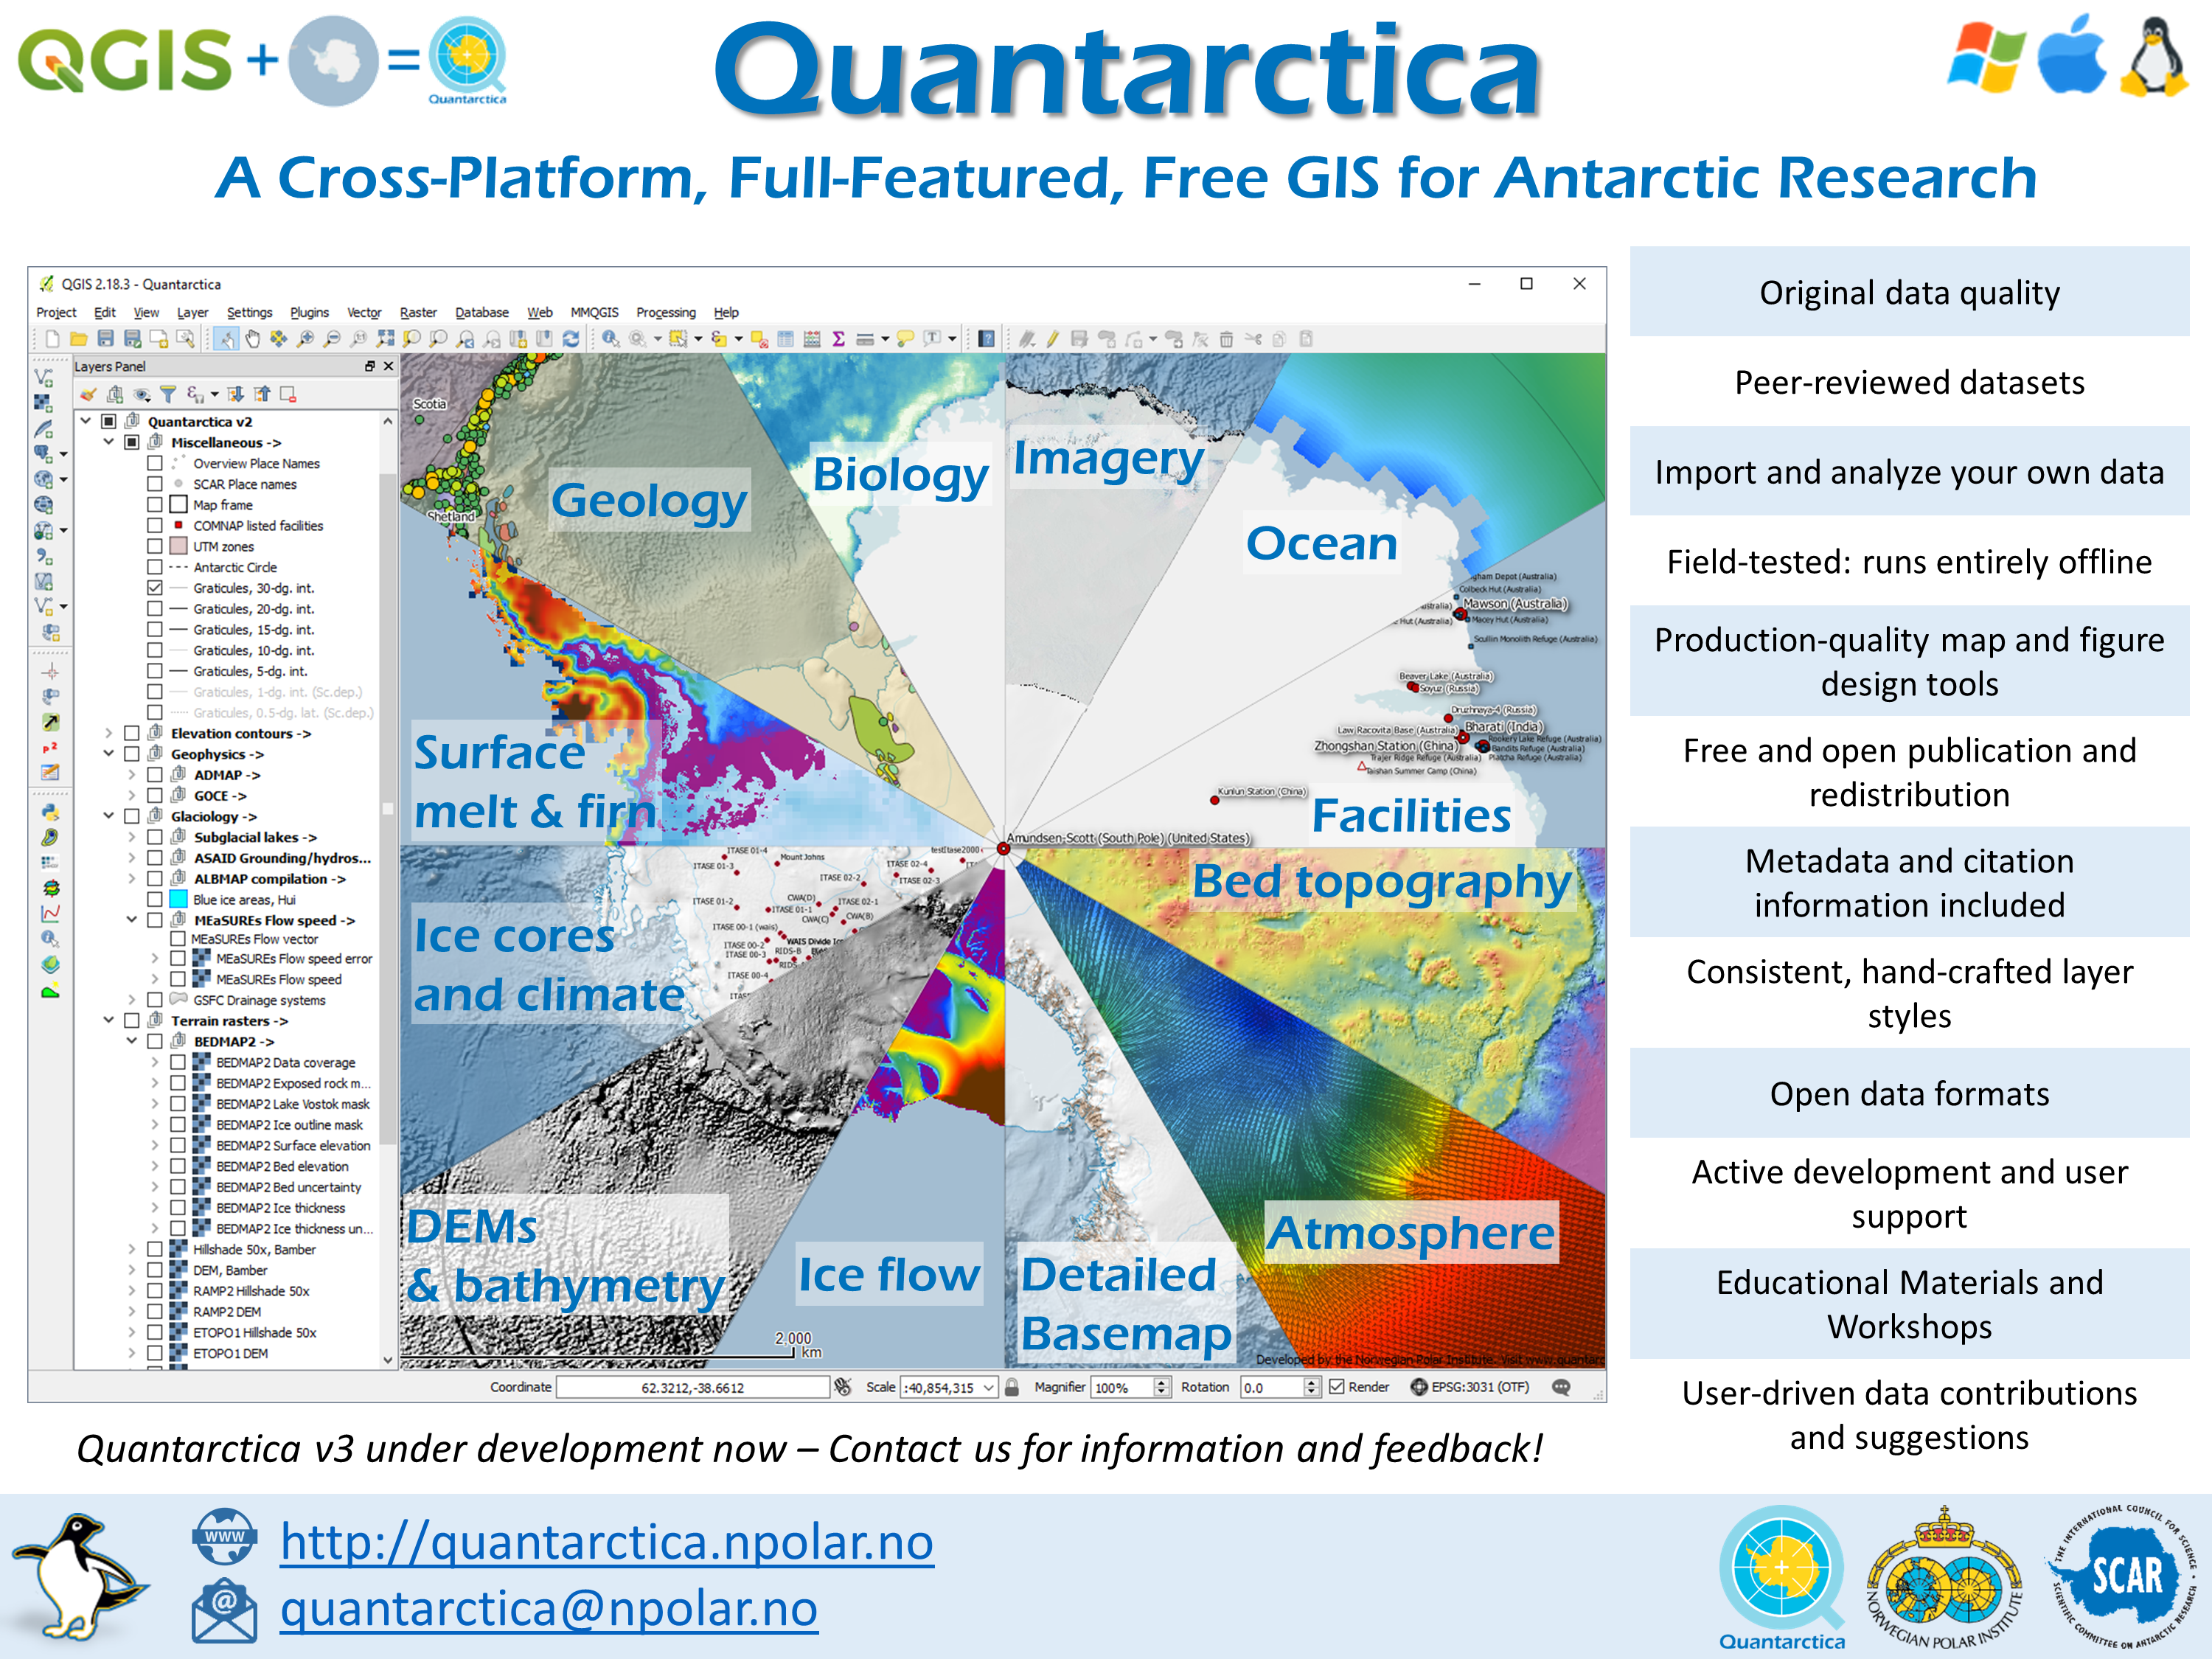
However, finding good map data and tools for Earth’s most sparsely-populated and poorly-mapped continent can be exhausting. The Quantarctica project (http://quantarctica.npolar.no/) aims to solve these problems by providing a package of pre-prepared scientific and geographic datasets, combined with easy-to-use mapping software for the entire Antarctic community.
In this webinar, we'll take a quick tour of what's available for you in Quantarctica before learning how to import and analyze your own scientific data. Then we'll dive into the world of cartographic design and show you how to create a great-looking, publication-quality map of your study site.
Registration link
https://attendee.gotowebinar.com/register/8483520940369720067